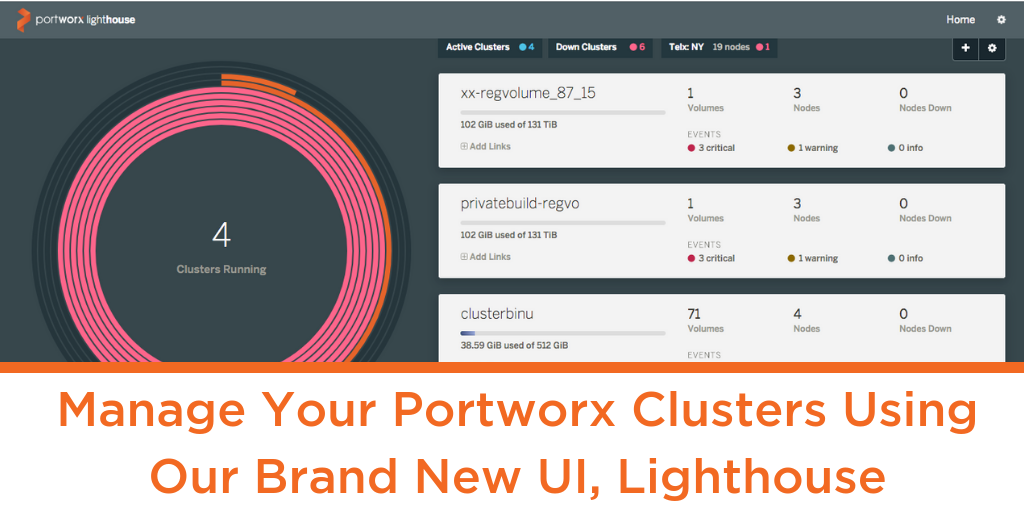
Lighthouse is an easy, intuitive and graphical way to manage and monitor Portworx clusters. Lighthouse runs as a Docker container which makes it possible to run it on a laptop. And with the new design, it is increasingly responsive.
As customers scale their environment, they want to have a birds-eye-view of their entire environment from where they can drill down into specific clusters. With the PX-Enterprise 1.4 release, it can now be used to monitor multiple Portworx clusters to not only ensure that all the clusters are in a healthy state, but also understand the number of nodes, volumes, and overall capacity consumed.
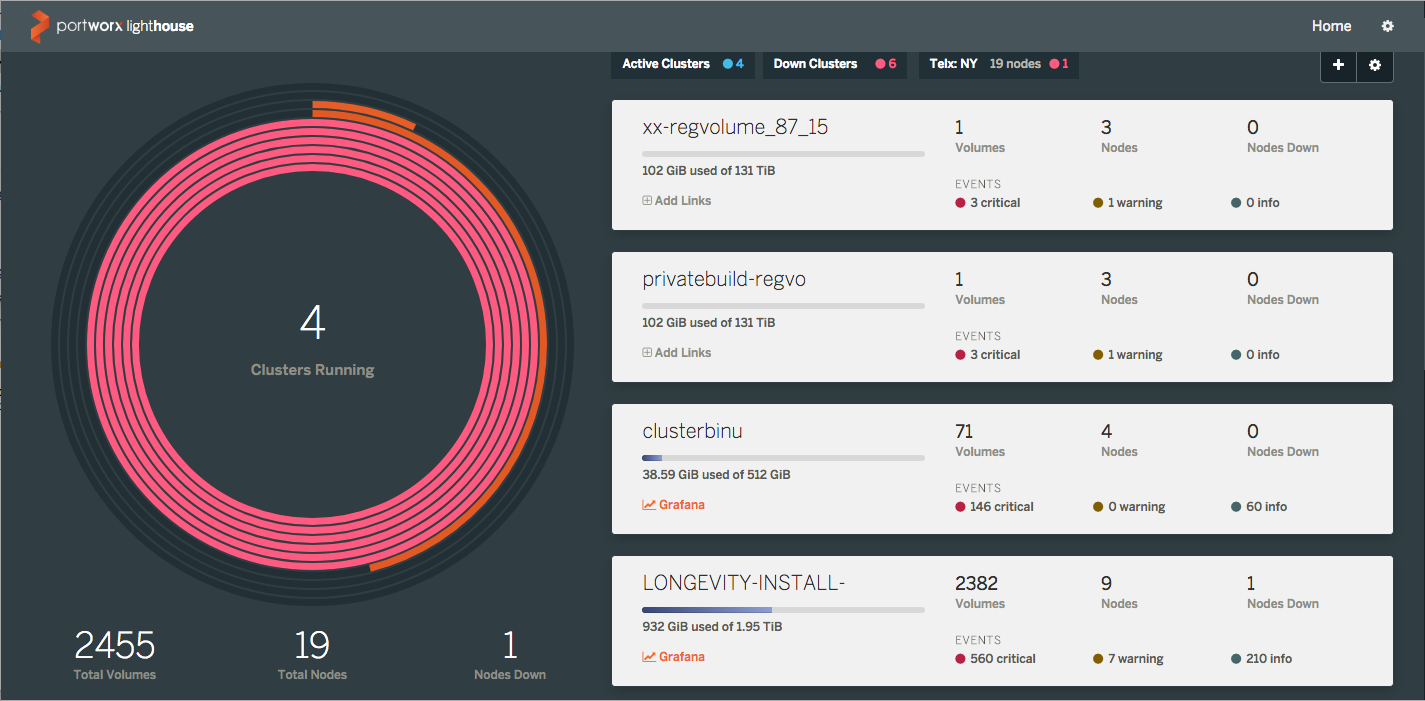
Adding/removing clusters in this view is straightforward (make sure you are using version 1.4). Simply click the add/manage icons on the top. The view can be configured by filtering clusters based on ‘active’ or ‘down’ status, or by region. You can click any cluster then to drill down into nodes, volumes, snapshots, or containers on that cluster.
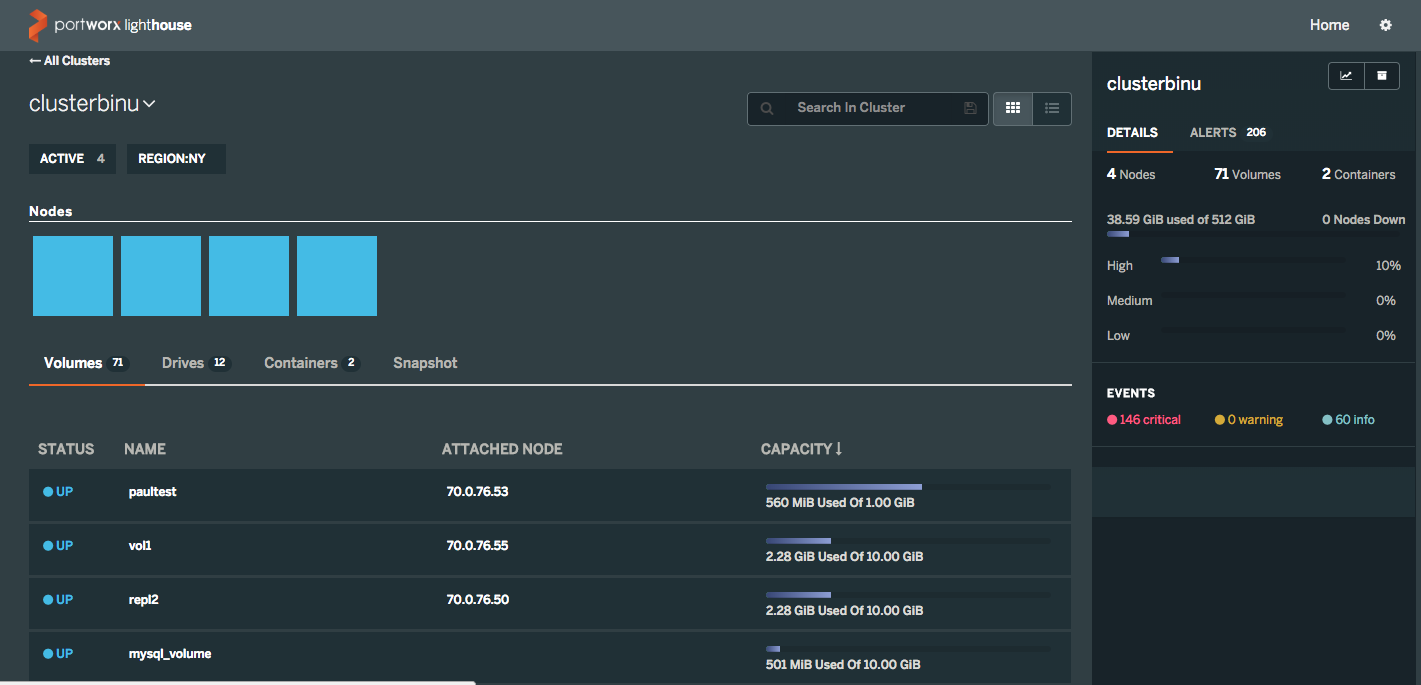
All the data on the cluster page above is searchable, making it easy to navigate to specific volumes or nodes.
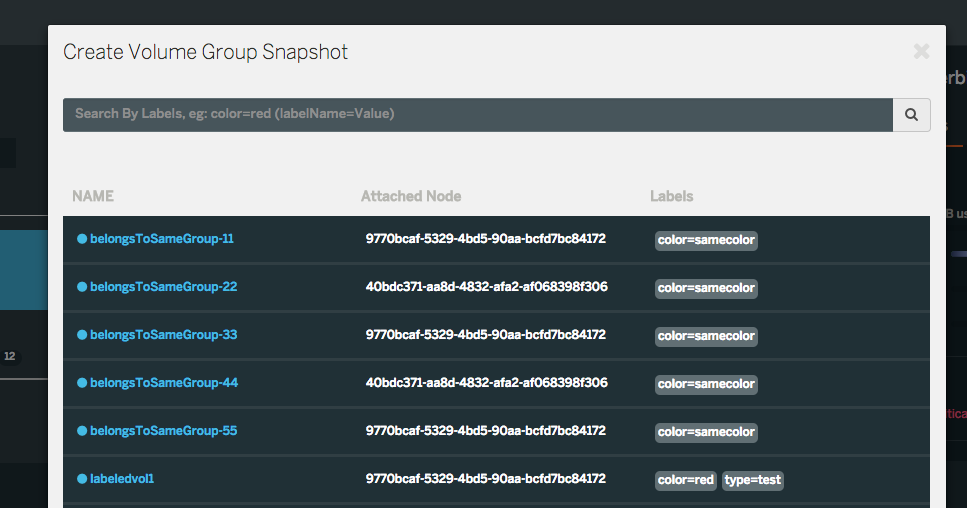
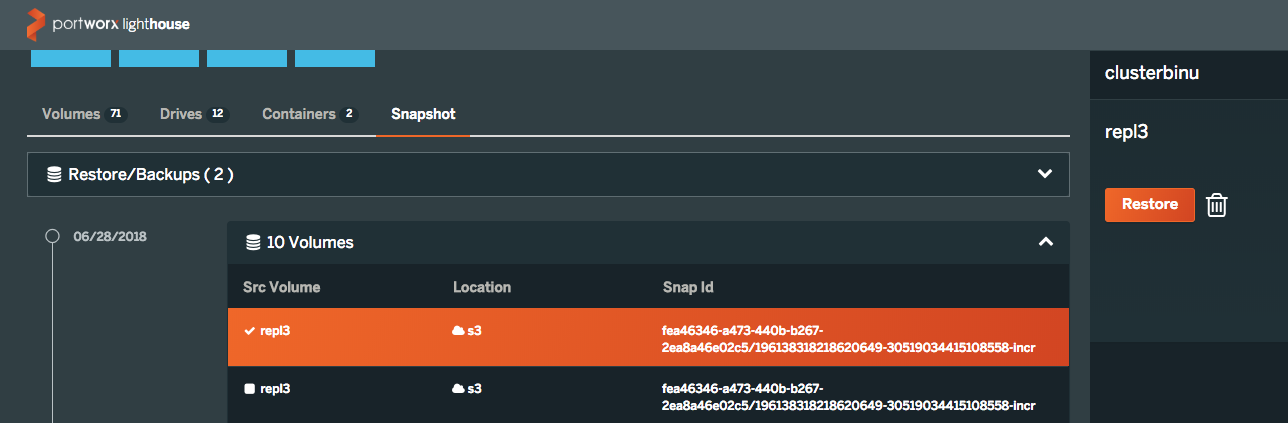
Events are part of the cluster information and clicking any event type shows an event timeline. With 1.4, we’ve added the ability to take group snapshots in addition local/cloud snapshots for backup. Recovery is straightforward using the restore option on any snapshot.
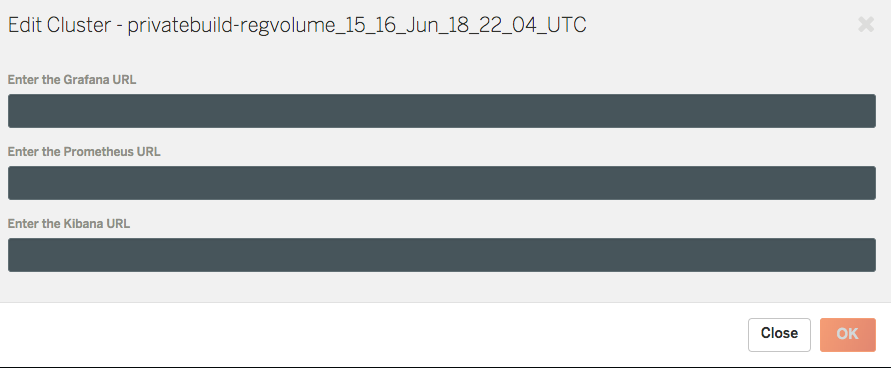
Based on our experience, we see that many customers use Prometheus and Grafana for metrics monitoring. Portworx has integration with these tools for quite some time now and in the latest version of Lighthouse, it is possible to have direct shortcuts to these services right from the dashboard. Adding the link is a one-time action from the cluster management page and gives a quick way to troubleshoot deeper with time-series data.
With this release, Lighthouse starts to become the “hub” for managing your Portworx clusters because of the following features:
- Monitoring multiple clusters from a single pane
- Visibility into any cluster’s resources (nodes/disks/volumes) as well as operations (single stats/alerts)
- Data Management with Volumes and Snapshots – including snapshot to cloud
- Quick shortcuts to proactive monitoring (Prometheus -> Grafana) and log analysis (Fluentd -> Elasticsearch -> Kibana)
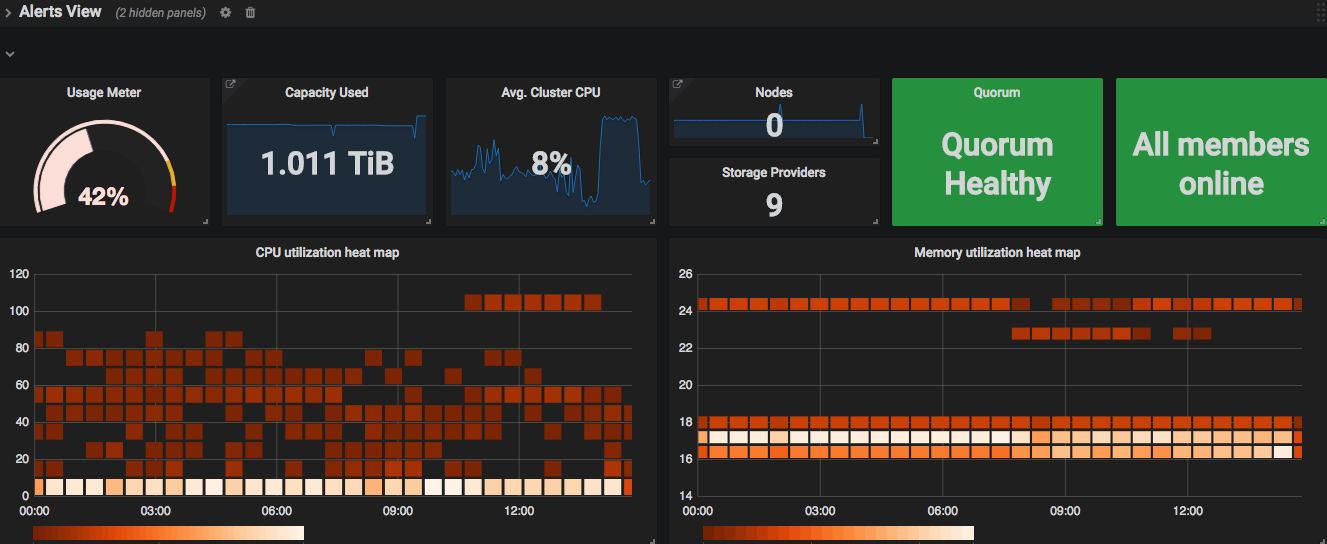
We will also be updating our Grafana templates here with new panels and improved visualization.
Share
Subscribe for Updates
About Us
Portworx is the leader in cloud native storage for containers.
Thanks for subscribing!

Prashant Rathi
Portworx | Director of Product ManagementExplore Related Content:
- Grafana
- kubernetes
- Lighthouse
- Prometheus